FULL papers: 25 + 5 minutes
NIER/TD papers: 10 + 5 minutes
Program: Monday, Tuesday
| 08:15 | Registration | |||
| 09:00 | Shared Keynote with SCAM: Visualization of Software-Clone Data: A Comprehensive Survey Rainer Koschke Burlington room | |||
| 10:00 | Coffee Break | |||
| 10:30 | Welcome | |||
| 10:40 | Session 1: Software Evolution Session chair: Craig Anslow Emanuele room | |||
|
Performance Evolution Matrix: Visualizing Performance Variations along Software Versions Juan Pablo Sandoval Alcocer, Fabian Beck and Alexandre Bergel preprint | website | FULL | |||
| Evo-Clocks: Software Evolution at a Glance Carol V. Alexandru, Sebastian Proksch, Pooyan Behnamghader and Harald C. Gall | FULL | |||
| Visualizing Code Genealogy: How Code is Evolutionarily Fixed in Program Repair? Yuya Tomida, Yoshiki Higo, Shinsuke Matsumoto and Shinji Kusumoto | NIER/TD | |||
| Enhancing Commit Graphs with Visual Runtime Clues Juan Pablo Sandoval Alcocer, Harold Camacho Jaimes, Diego Costa, Alexandre Bergel and Fabian Beck preprint | website | NIER/TD | |||
| 12:10 | Lunch | |||
| 13:30 | Session 2: Meta-Analysis of Software Visualization Session chair: Fabian Beck Emanuele room | |||
| A tertiary systematic literature review on Software Visualization Laure Bedu, Olivier Tinh and Fabio Petrillo | FULL | |||
| VISON: An Ontology-Based Approach for Software Visualization Discoverability Leonel Merino, Ekaterina Kozlova, Oscar Nierstrasz and Daniel Weiskopf | FULL | |||
| A User Study on the Usefulness of Visualization Support for Requirements Monitoring Lisa Maria Kritzinger, Thomas Krismayer, Rick Rabiser and Paul Grünbacher | FULL | |||
| 15:00 | Coffee Break | |||
| 15:30 | Session 3: Eye Tracking, VR/AR Session chair: Leonel Merino Emanuele room | |||
| Exploring Eye Tracking Data via Dual Space Analysis Li Zhang, Jianxin Sun, Cole Peterson, Bonita Sharif and Hongfeng Yu | FULL | |||
| Speak to your Software Visualization - Exploring Component-based Software Architectures in Augmented Reality with a Conversational Interface Peter Seipel, Adrian Stock, Sivasurya Santhanam, Artur Baranowski, Nico Hochgeschwender and Andreas Schreiber website |
NIER/TD | |||
| CodeHouse: VR Code Visualization Tool Akihiro Hori, Masumi Kawakami and Makoto Ichii | NIER/TD | |||
| 16:30 | Demo and Poster Session Session chair: Roberto Minelli | |||
| 19:00 | Banquet at Butcher and The Brewer | |||
| 08:00 | Registration | |||
| 09:00 | Keynote: Algorithms and Metaphors for Graph Visualization Stephen Kobourov Session chair: Craig Anslow Emanuele room | |||
| 10:00 | Coffee Break | |||
| 10:30 | Session 4: Code Clones, Metrics, and Maintenance Session chair: Alexandre Bergel Emanuele room | |||
|
CloneCompass: Visualizations for Exploring Assembly Code Clone Ecosystems Ying Wang, Jorin Weatherston, Margaret-Anne Storey and Daniel German | FULL | |||
| CorpusVis: Visualizing Software Metrics at Scale Jack Slater, Craig Anslow, Jens Dietrich | FULL | |||
|
Visually Exploring Software Maintenance Activities Stanislav Levin and Amiram Yehudai | NIER/TD | |||
| 11:45 | Paper Awards | |||
| 12:00 | Lunch | |||
| 13:30 | Session 5: Most Influential Paper Award A System for Graph-Based Visualization of the Evolution of Software A (Short) Exercise in Reproduction by Christian Collberg Session chair: Johan Fabry Emanuele room | |||
| 14:30 | Closing | |||
| 15:00 | Coffee Break | |||
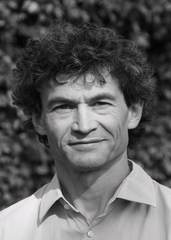
Keynote: Algorithms and Metaphors for Graph Visualization, Stephen Kobourov

Abstract. Relational data sets are often visualized with graphs: objects become the graph vertices and relations become the graph edges. Graph drawing algorithms aim to present such data in an effective and aesthetically appealing way. Map representations, provide a way to visualize relational data with the help of conceptual maps as a data representation metaphor. While graphs often require considerable effort to comprehend, a map representation is more intuitive, as most people are familiar with maps and standard map interactions via zooming and panning. The graph-to-map (GMap) algorithmic framework will be discussed, including applications, as well as experimental results on the effectiveness of the approach.
Bio. Stephen Kobourov is a Professor of Computer Science at the University of Arizona. He completed BS degrees in Mathematics and Computer Science at Dartmouth College in 1995, and a PhD in Computer Science at Johns Hopkins University in 2000. He has worked as a Research Scientist at AT&T Research Labs, as Hulmboldt Fellow at the University of Tübingen in Germany, and as a Distinguished Fulbright Chair at Charles University in Prague.
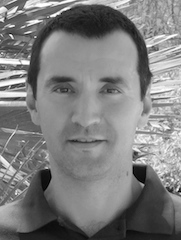
Shared Keynote with SCAM: Visualization of Software-Clone Data: A Comprehensive Survey, Rainer Koschke

Abstract. Detecting software clones (similar pieces of code) has been a research subject for more than 25 years and is also a recurring subject at SCAM. The very first visualization of clone data appeared as early as 1992, too. The first publications on visualizing clone data at SCAM and VISSOFT, however, appeared only in 2007 and 2013, respectively. In the last 27 years diverse types of visualization have been proposed to make the large volume of complex clone data more accessible to human beholders. In this talk, I will present the result of a systematic mapping study of clone visualization techniques. This survey is a joint effort with my colleagues Muhammad Hammad, Hamid Abdul Basit, and Stan Jarzabek. We summarize and classify the contribution of 68 publications on clone visualization, describe research gaps, and discuss potential future research directions for both the SCAM and VISSOFT community.
Bio. Rainer Koschke is a full professor for software engineering at the University of Bremen in Germany and heading the software engineering group. His research interests are primarily in the fields of software engineering, program analyses, and software visualization. His current research includes program analyses, clone detection, visualization in VR and AR, reverse engineering, architecture recovery, feature location, and security. He is one of the founders of Axivion GmbH (founded in 2006) providing solutions for stopping software erosion. He received a doctoral degree in computer science at the University of Stuttgart, Germany in 1999.